How to Create Mind Map Infographics Using NotebookLM
We all face the same challenge: drowning in content. Between textbooks, research papers, and dense reports, retaining key information gets harder by the day. The real issue isn't having access to knowledge—it's organizing it in a way your brain can actually process. That's where mind maps come in. NotebookLM lets you generate structured mind maps automatically, turning chaotic information into visual knowledge you can actually remember and build on.
Creating a mind map in NotebookLM does more than save time—it fundamentally changes how you learn. Your ideas get arranged in a clear hierarchy that's easy to follow, remember, and expand upon. Here's how to build one from scratch.
1. Creating a Mind Map in NotebookLM
Step 1:
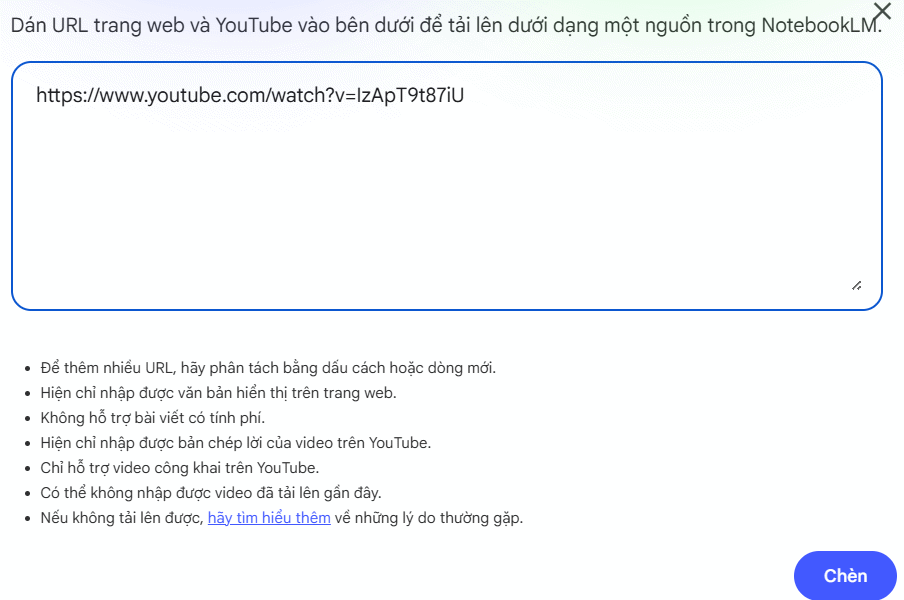
Start by gathering your source material. This could be a YouTube video, a PDF document, or any learning resource—for instance, a video about Vietnamese history for grade 12 students. Head to NotebookLM, create a new notebook, and paste your source material in.
Step 2:
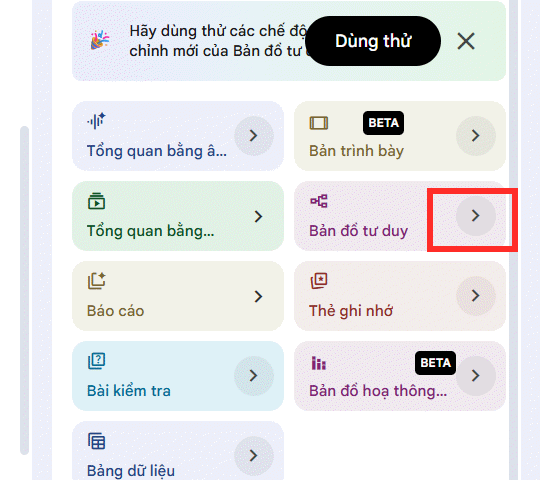
Once NotebookLM processes your content, look for the arrow icon next to "Mind Map" in the sidebar and click it to get started.
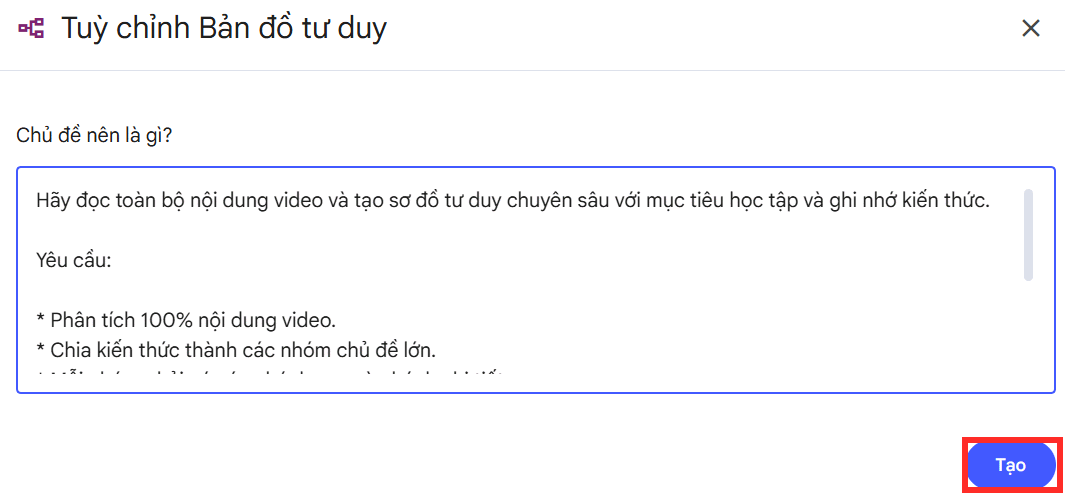
Now type in your instructions for how you want the mind map structured, then hit Create.
Step 3:
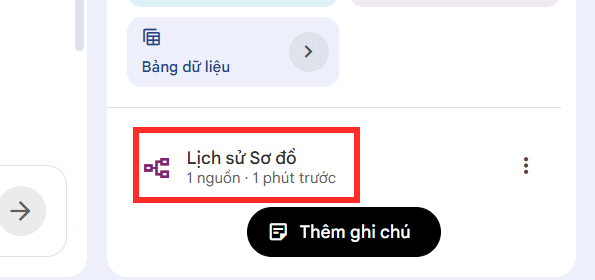
Wait while NotebookLM analyzes your material and generates the mind map. When it's ready, click the map's title to view it.
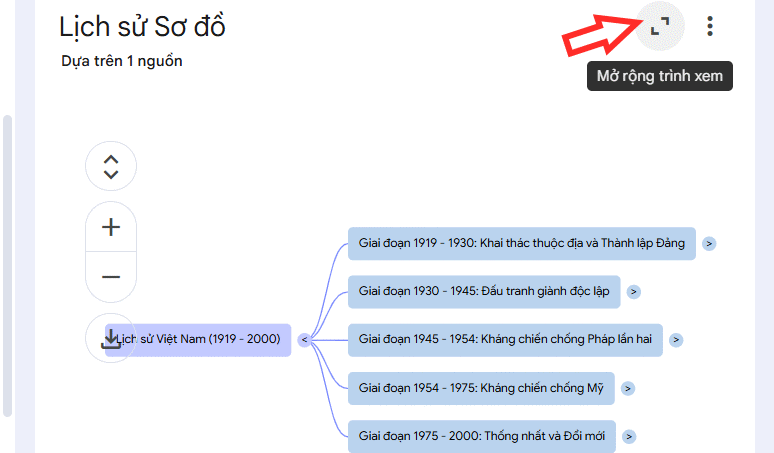
Click the expand icon to see the complete mind map in full view.
Step 4:
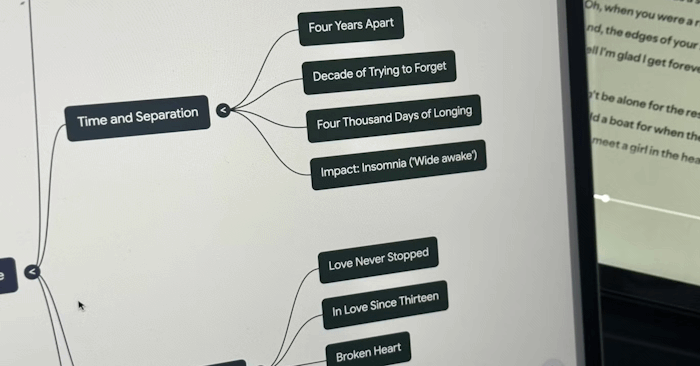
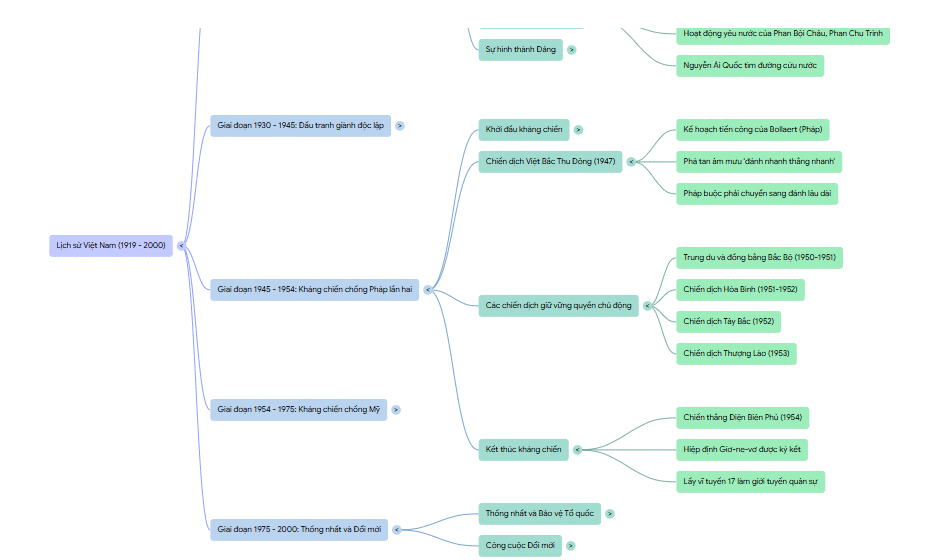
Each branch has its own expand icon—click any branch to reveal the detailed knowledge and information nested inside.
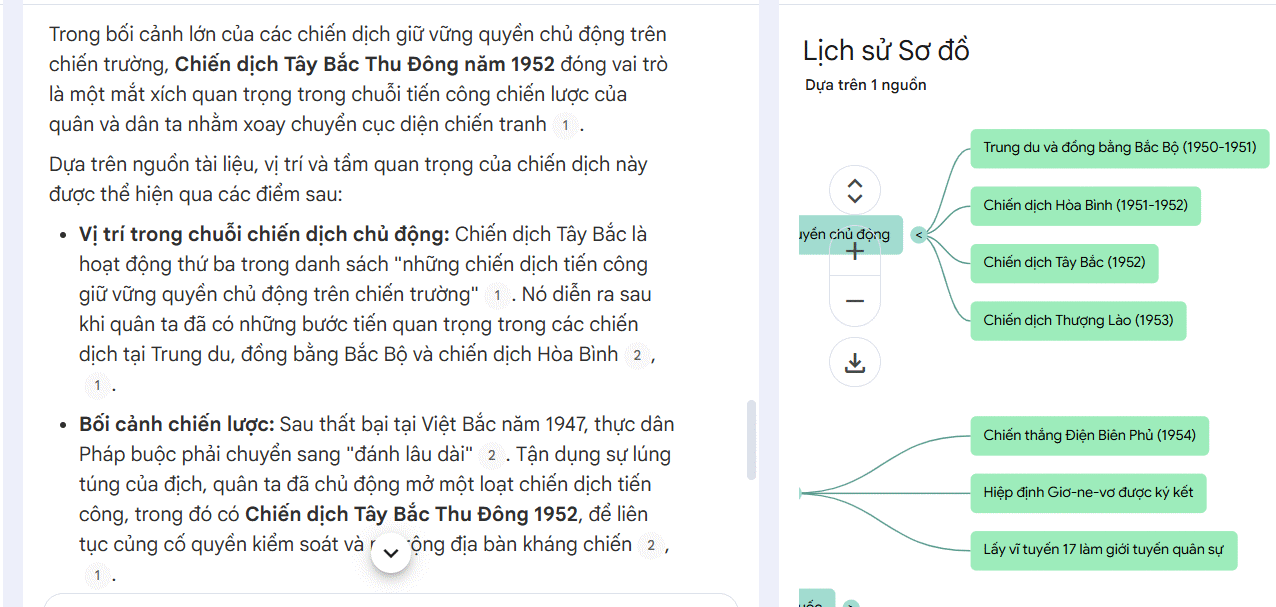
When you click a specific item in the mind map, NotebookLM displays detailed information in the sidebar—concise but complete, giving you exactly what you need to remember the material. You can also add follow-up prompts here if you want to dig deeper.
To download your mind map, hit the save icon and export it as a PNG file.
2. Converting Your Mind Map Into an Infographic
Here's where it gets interesting. Once you've downloaded your NotebookLM mind map as a PNG, you can level it up by transforming it into a professional infographic using ChatGPT—complete with icons, illustrations, and polished design.
Upload your mind map image to ChatGPT, then paste the following prompt to have it redesign your map into a visually stunning infographic:
I'm uploading a mind map image. Please read all the content and transform it into a modern, professional infographic.\
\
OBJECTIVES\
\
- Do not recreate the mind map structure.\
- Redesign it into a visually appealing, beautiful, and easy-to-read infographic while preserving 100% of the content and hierarchical structure.\
\
REQUIREMENTS\
\
- Keep all content intact.\
- Do not omit, add, or modify any points.\
- Maintain the original branch order.\
- Number only main branches (1, 2, 3, 4...), not sub-branches.\
- Convert sub-points within the same group into bullet lists to save space.\
- Do not create individual boxes for each small point like in a mind map.\
- Group related content into clear information cards.\
\
DESIGN\
\
- Modern editorial infographic style.\
- Balanced layout with generous whitespace.\
- Main topic highlighted in the center.\
- Primary branches distributed evenly around the main topic.\
- Soft, curved connecting lines.\
- Each main branch gets its own color.\
- Sub-branches use lighter shades of the same color.\
- Rounded content boxes with subtle shadows.\
- Clear typography with strong visual hierarchy.\
\
ILLUSTRATIONS\
\
- Combine relevant illustrations and icons.\
- Each main branch includes one large illustration directly related to its content.\
- Each content group can include a small supporting icon.\
- Add small illustrations or thumbnails next to important information sections where appropriate.\
- Avoid icon overload.\
- Do not replace all illustrations with icons.\
\
ILLUSTRATION STYLE\
\
- Flat vector illustration\
- Editorial illustration\
- Semi-flat\
- Modern\
- Cohesive\
- Harmonious color palette\
\
QUALITY\
\
- Publication-ready quality.\
- Clean and polished.\
- Professional.\
- Readable at a glance.\
- Visual depth.\
- 16:9 aspect ratio.\
- High resolution.\
- Suitable for presentations, Canva, websites, or A3 printing.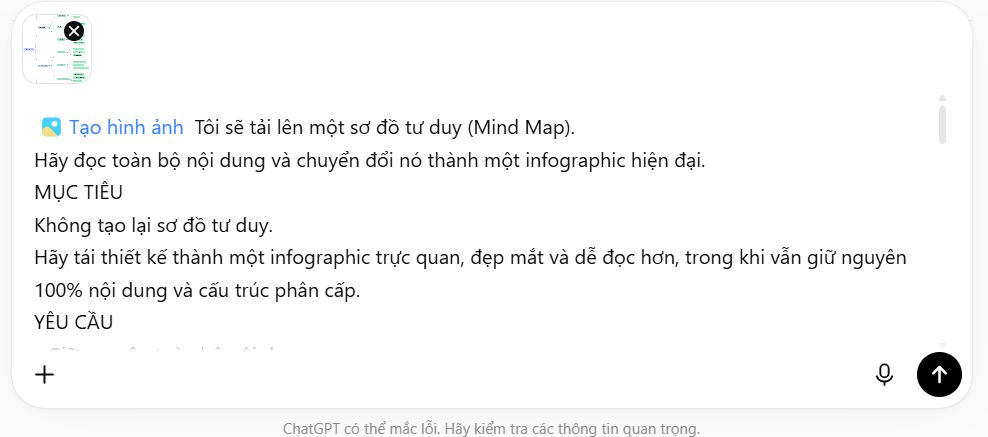
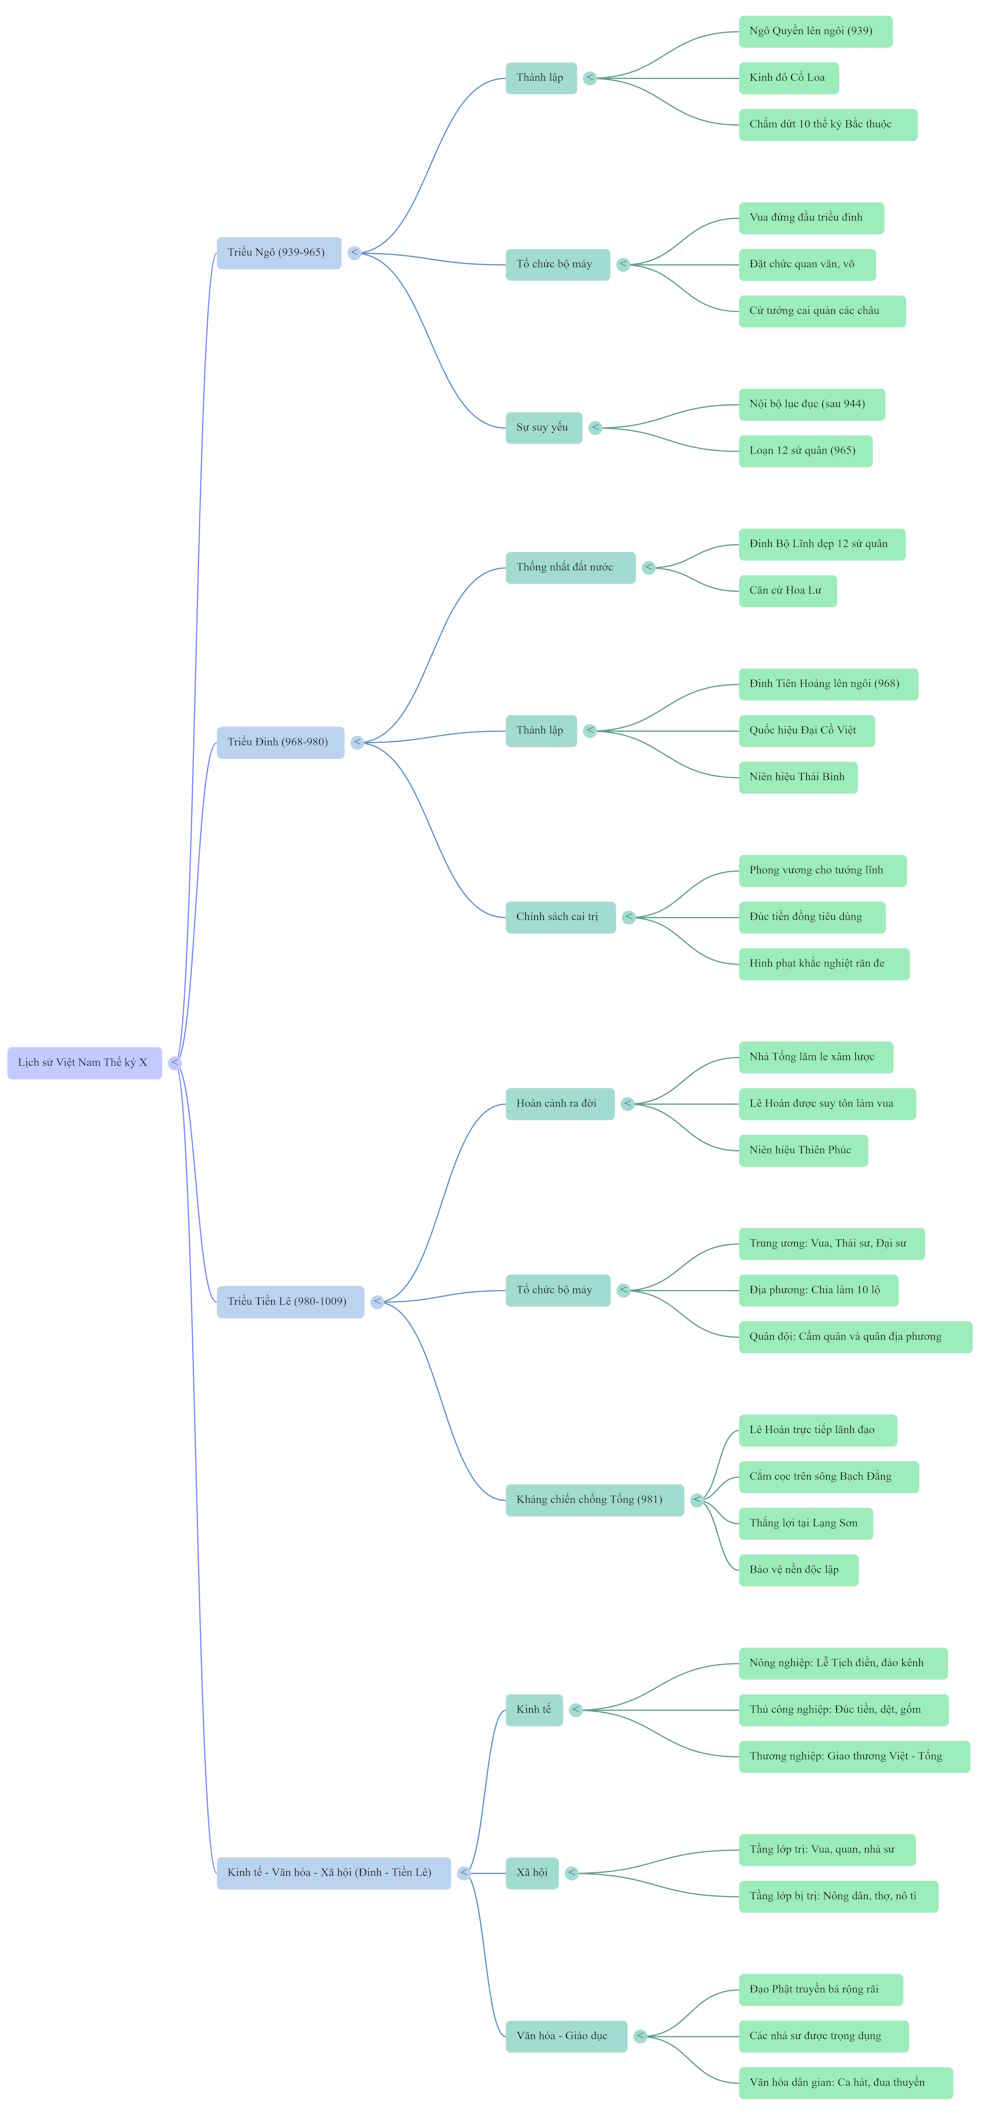
What's interesting here is how quickly ChatGPT transforms the map. You'll immediately see an infographic that builds on your original mind map structure. Here's an example mind map created in NotebookLM:
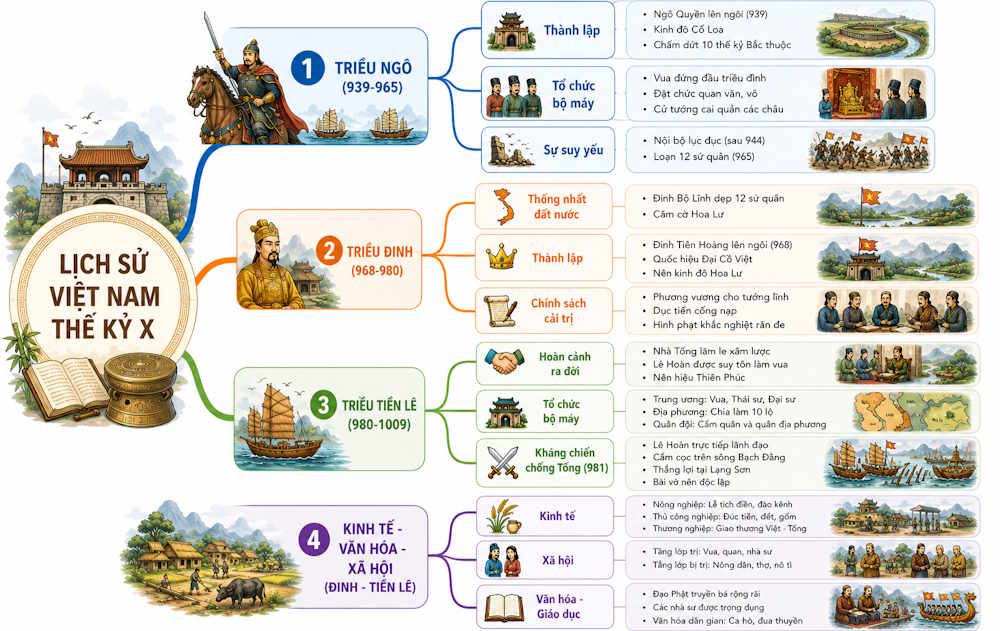
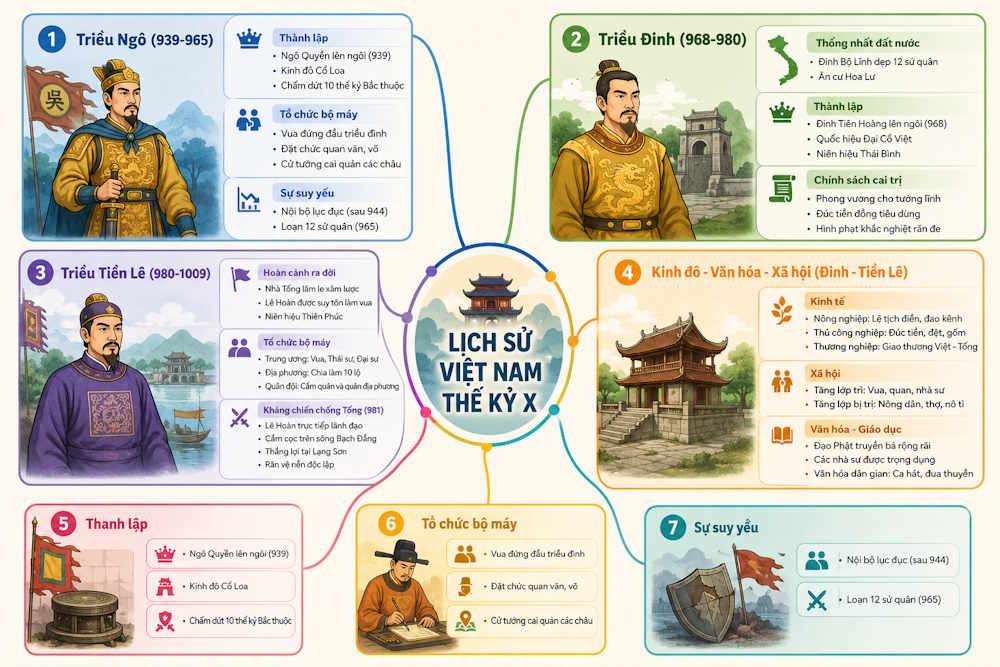
And here's the polished infographic generated from that same map:
Description: Learn to build mind maps with NotebookLM and transform them into stunning infographics using ChatGPT. Step-by-step guide included.
Related Articles
- 8 Effective Methods to Monitor Your Hard Drive Health and Catch Problems Early
- How to Fix the Task Host Window Blocking Windows Shutdown
- How to Restore a Windows System Using UEFI-Compatible .tib Ghost Files
- Understanding Mesh WiFi: How Does a Mesh Network System Actually Work?
- The 22 Best Tools for Creating Bootable USB Drives
No Comment to " How to Create Mind Map Infographics Using NotebookLM "